LLANRHIDIAN PRIMARY SCHOOL
Inspiring our learners to be the best they can be!
IQ
LO. To represent data in a table/pictorgram.
Here are examples of the types of graphs you will use to represent your data.

Use the data that you collected during your food tasting activity and represent it in either a bar graph or a pictogram.
-----------------------------------------------------------
LO. To compare two Welsh artists.
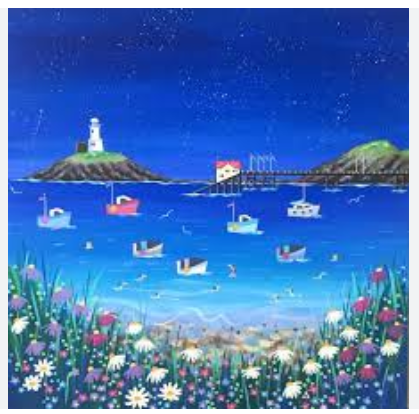
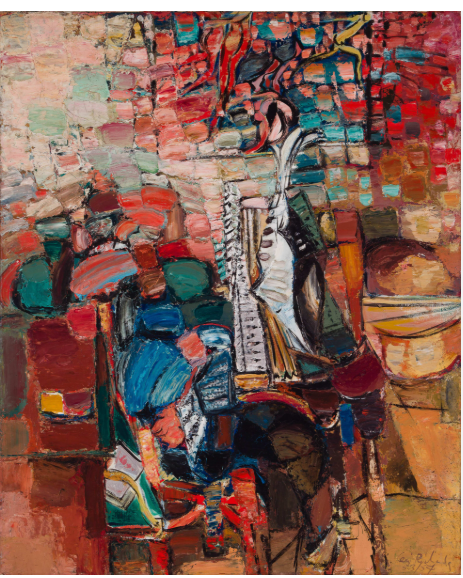
Miss Walters has 2 favourite Welsh artists, Annabel Dann and Ceri Richards!
Miss Walters thinks that their art looks very different. Can you look at each artist and tell us what you think?
-
“What do you notice first?”
-
“How do the colours make you feel?”
-
“Is it realistic or abstract?”
----------------------------------------------------------
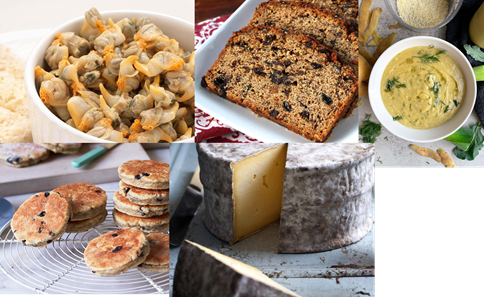
LO. To try different Welsh foods.
Taste the different Welsh foods and give each 'area' a score out of 5. The areas you are scoring are; taste, smell, texture and appearance.
-----------------------------------------------------------
LO. To create a Welsh Cynefin flag.


