LLANRHIDIAN PRIMARY SCHOOL
Inspiring our learners to be the best they can be!
Mathmateg-Statistics
What is data?
When do we use it?
How can we represent it?
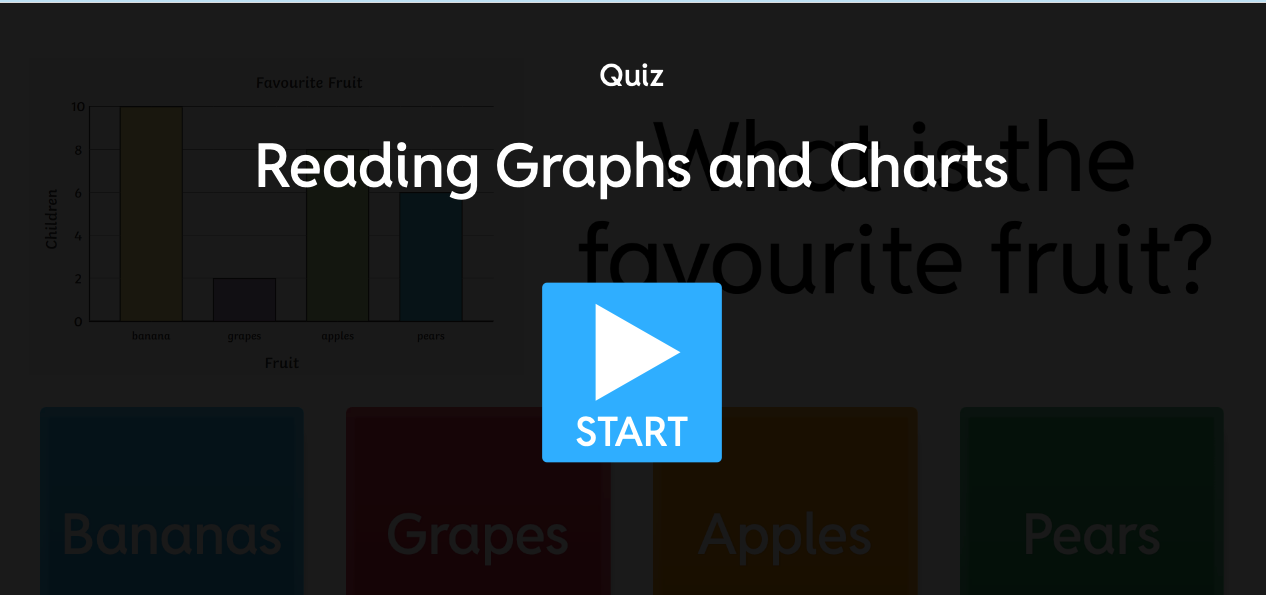
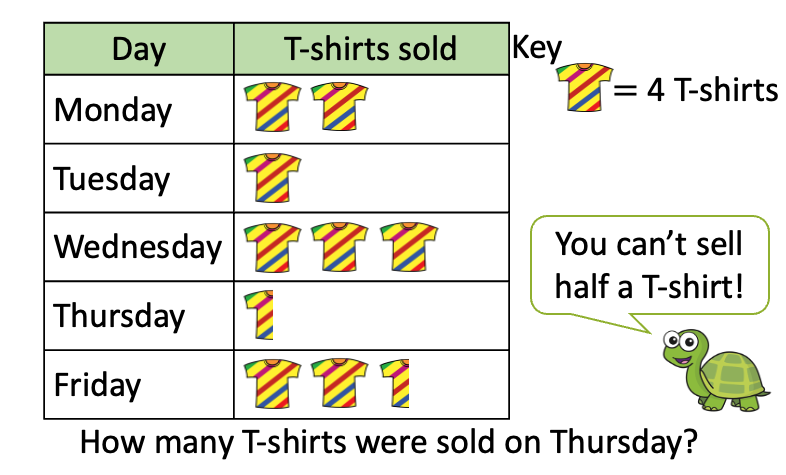
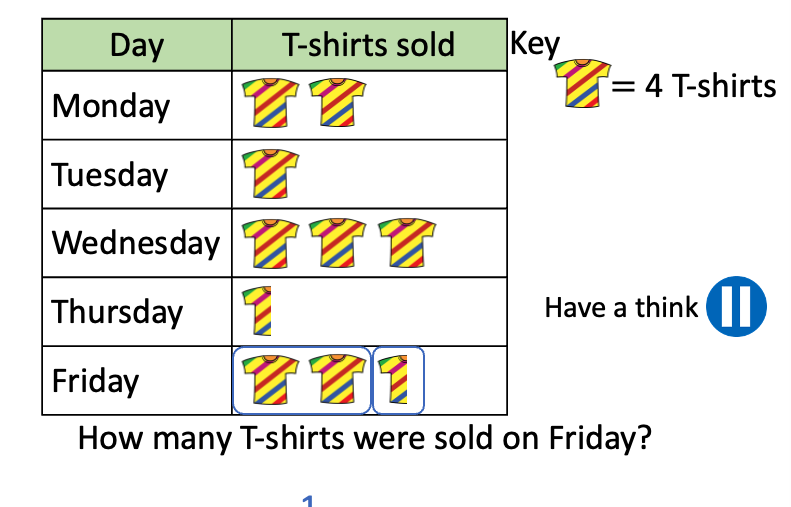
Let's have a look at how some data is represented below.
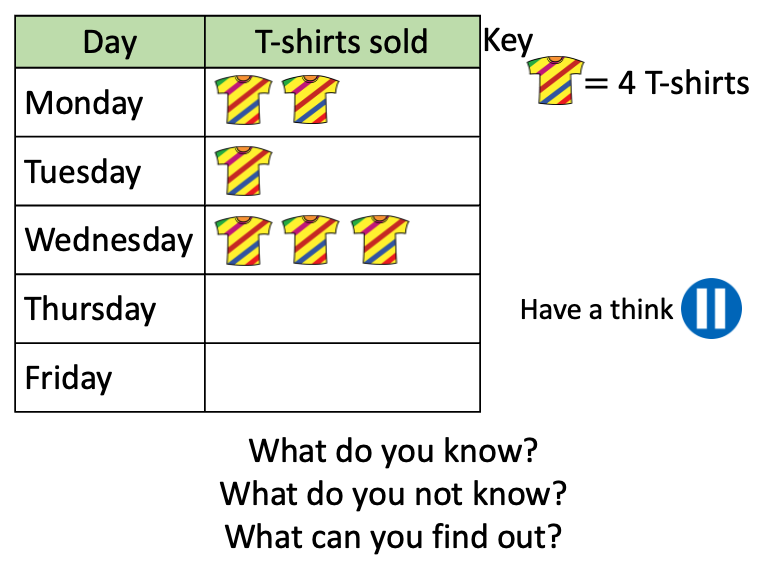
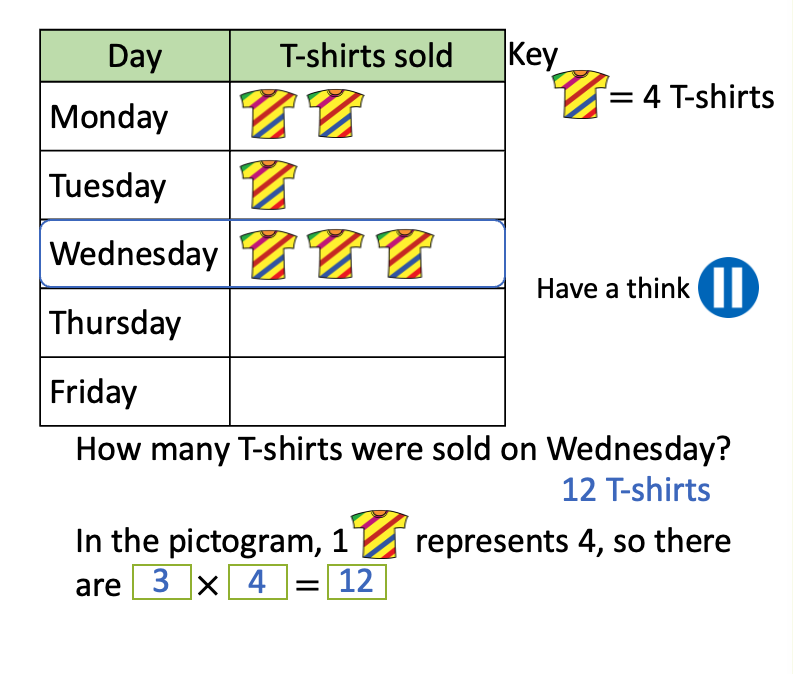
Now let's have a look at some data represented in a different way.
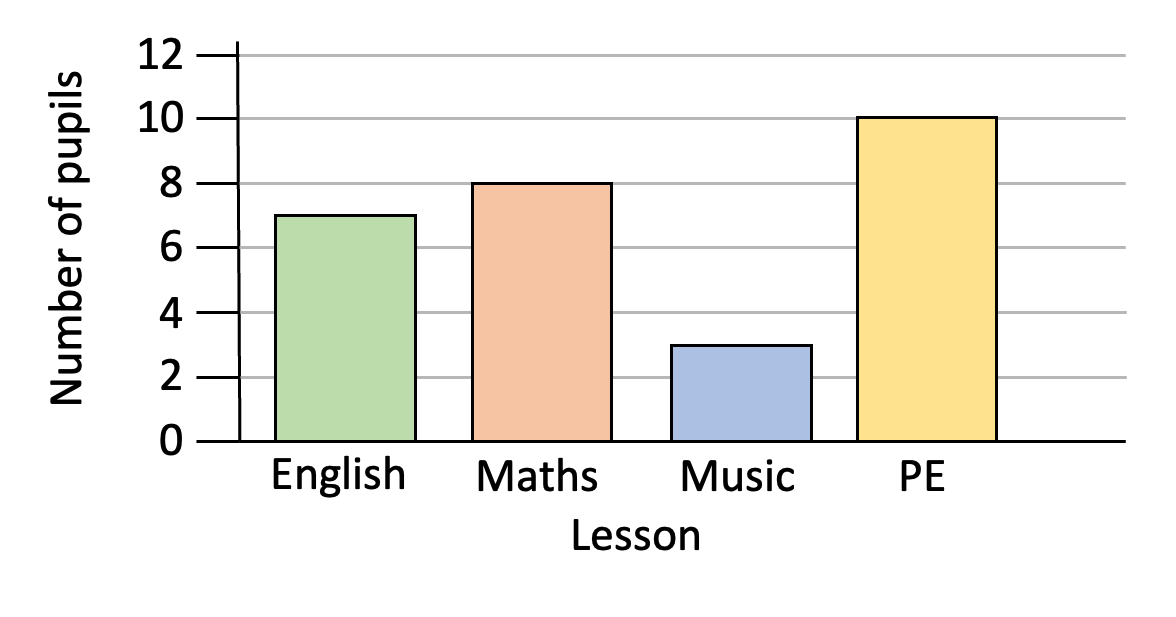
Let's interpret this data.
What does the bar graph tell us?
How many pupils prefer music?
How many fewer pupils prefer music to maths?
What does the word fewer mean? How can we calculate this?
On your whiteboards, create a pictogram to represent the data in the bar graph.