
LLANRHIDIAN PRIMARY SCHOOL
Inspiring our learners to be the best they can be!
Amser Sgwn i

Develop - Build Knowledge and Understand
Enquiry: 🌍 I wonder, how are humans changing the animal kingdom?
LO: To explain the impact of actions on local, national and global levels.
What is conservation and wildlife recovery?
Questions to think about...
Should humans have got involved, or should nature have been left to take its course?
Should humans always help endangered animals?
Should money be spent on wildlife recovery if there are other problems in society?
Should people be allowed to change habitats if it benefits humans?
Task...
In your own words, explain....
What is conservation?
What is wildlife recovery?
Also, include your opinion on what we discussed above.
Wedi gorffen?
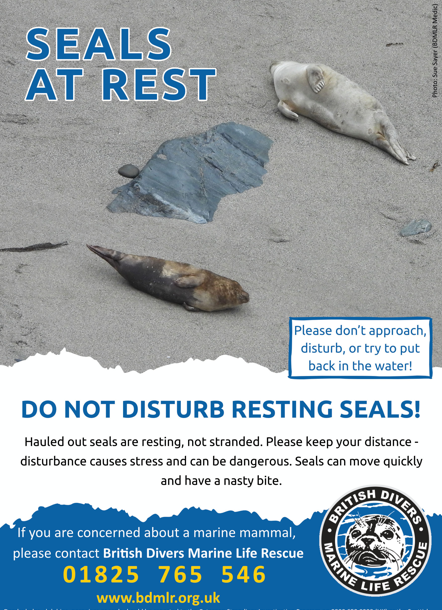
Create a poster for the British Divers Marine Life Rescue
Plastic Waste Around the World
L.O: To collect, present and interpret real-world data.
Plastic use and waste has a huge impact on our environment.
https://www.natgeokids.com/uk/kids-club/cool-kids/general-kids-club/plastic-pollution/
Scientists collect data to understand environmental problems. Today, you are going to investigate how much plastic waste is produced per person in different parts of the world.
The data below is from the OECD’s Global Plastics Outlook and shows the estimated amount of plastic waste produced by one person in one year, in 2019.
Country or region |
Plastic waste per person per year |
USA |
221 kg |
Canada |
178 kg |
European Union countries |
122 kg |
Japan and Korea |
69 kg |
China |
47 kg |
India |
14 kg |
Create a bar chart titled:
Plastic Waste Produced Per Person Around the World
What does your bar chart need?
-
x-axis: country/region
-
y-axis: kilograms of plastic waste per person per year
-
scale: count in 20s, up to 240 kg
-
use a ruler, equal-width bars and gaps between each bar
Analyse your findings
-
Which country/region produces the most plastic waste per person?
-
Which produces the least?
-
How much more plastic waste does one person in the USA produce than one person in India?
-
Put the countries/regions in order from greatest to least plastic waste per person.
-
Which two countries/regions produce less than 70 kg per person?
-
Why might high levels of plastic waste be dangerous for animals and their habitats?
-
What could people, businesses or governments do to reduce the amount of plastic waste?
Challenge
If a class of 30 people in the USA each produced 221 kg of plastic waste in a year, how much plastic waste would they produce altogether?
If the class managed to reduce their plastic waste by 25%, how many kilograms would they save?
Write a short data conclusion:
The data suggests that ______ produces the most plastic waste per person. It produces ______ kg more than ______. This matters because ______.